Why Your Cost Per Lead Keeps Rising
By Jetson, Head of CRO at ThriveX
Reading time: 6 minutes. Last updated: September 2026.
Author's Note
Most founders assume a rising cost per lead is just what the market does now, so they absorb it and raise the budget. The 2026 benchmark data says otherwise, and that changes the diagnosis completely. If your CPL is climbing while the industry average fell, you are not experiencing market conditions, you are experiencing something specific to your funnel. This guide covers what that something usually is. If you want a direct read on which part of your funnel is inflating your cost per lead, the ThriveX AI Audit checks this specifically.
The Market Average Went Down, Not Up
Across all industries, cost per lead decreased overall in 2026 for the first time in five years, with the all-industry average sitting at $66.69. That is the opposite of what most advertisers assume is happening.
Cost per click did rise over the same period, reaching an all-industry average of $5.42 . Clicks got more expensive while leads got cheaper, which only happens when conversion rates improve enough to absorb the higher click cost.
That combination is the whole diagnosis in one line. The advertisers whose CPL fell were converting a higher share of the traffic they paid more for. If your CPL rose in the same market, your conversion rate moved the wrong way while your click costs moved the same way everyone else's did. The market handed you a harder input and your funnel did not compensate.
What Cost Per Lead Actually Measures
Cost per lead is ad spend divided by leads generated, which means it has exactly two inputs: what you pay for traffic, and what share of that traffic converts. You control very little of the first and most of the second.
Click cost is set in an auction against competitors, and it drifts upward as more advertisers enter. Conversion rate is set by your page, your offer, and your form. When founders describe CPL as a market problem, they are treating a two-input metric as though only the input they cannot control exists.
For example, an account paying $5 per click converting at 5% pays $100 per lead. The same account converting at 10% pays $50 per lead on identical traffic at identical cost. Nothing about the auction changed. The entire difference sits after the click, which is the same reason more ad spend doesn't mean more conversions when the funnel is the constraint.
Your Number Needs an Industry, Not an Average
The all-industry average is close to useless as a personal benchmark, because CPL ranges from $26.84 to $131.63 depending on sector. A $90 CPL is alarming in one industry and a strong result in another.
[CHART GOES HERE]
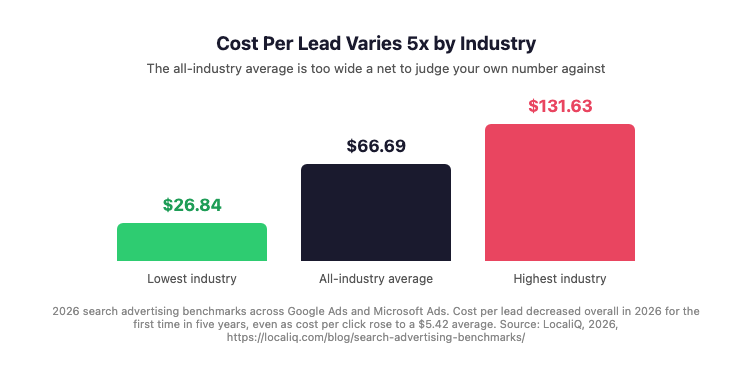
Figure 1 demonstrates the spread in 2026 cost per lead across industries, showing that the all-industry average of $66.69 sits inside a range wide enough to make it misleading as a benchmark for any single business.
On the conversion side, Ruler Analytics' 2026 benchmark, tracking over 5 million conversions across 13 industries, puts the average lead conversion rate at 5.13%. Checking your own conversion rate against that figure tells you more about your CPL trajectory than any cost benchmark will, because conversion rate is the input you can actually move.
Where Rising CPL Actually Comes From
Four causes account for most CPL increases that are not explained by the auction.
Conversion Rate Slipped Quietly
A conversion rate falling from 6% to 4% raises CPL by 50% with no change in click cost at all. Because the drop is gradual and the CPL rise is what gets reported, the actual cause never gets named.
Traffic Composition Changed
Broader targeting, new placements, or automated matching bring in visitors with weaker intent. The click costs the same and converts worse, so CPL rises while every campaign setting looks untouched.
The Form Became the Bottleneck
Extra fields, a new qualifying question, or a form that broke on mobile all reduce completion without reducing traffic. It is also one of the easiest causes to miss, and it is covered directly in why your contact form is losing you leads.
The Landing Page Stopped Matching the Ad
Ad copy gets refreshed more often than landing pages do. When the two drift apart, the click still arrives and the visitor still leaves, which is the mechanism behind a landing page that is not converting.
Diagnostic Checklist
Your rising CPL is a funnel problem, not a market problem, if:
Your conversion rate is lower than it was six months ago on comparable traffic
Your cost per click rose roughly in line with the market but your CPL rose faster
Your CPL sits well outside the normal range for your specific industry, not just above the all-industry average
Form completion rate dropped without a corresponding drop in traffic to the form
Your landing pages have not been revised since your ad creative was last refreshed
Nobody can state your current conversion rate from memory
Fix Sequence
Pull conversion rate over the same period as the CPL rise, so you can see which input actually moved
Compare your CPL against your industry's range, not the all-industry average
If conversion rate fell, find the step where it fell rather than adjusting bids
Check form start-to-completion rate separately from page traffic
Re-align landing page copy with whatever the current top-spending ads actually promise
Only after conversion rate stabilises, revisit bidding and budget
What This Check Looks Like in Practice
Say cost per lead has risen three months in a row and the question on the table is whether to cut paid search. Here's how the checklist above settles it before anyone touches the budget.
Pull cost per click and conversion rate for the same three months, side by side. If cost per click rose modestly and conversion rate held, the market is the story. If conversion rate fell over the same period, the rise is coming from your side of the click.
Next, look at the enquiry form on its own. Compare how many people start it with how many finish it. A form that gained extra fields, a new qualifying question, or a required phone number can lose a large share of completions without any change in traffic.
Then read the landing page next to the ad that currently spends the most. If the ad promises one thing and the page leads with another, fix that mismatch before changing a single bid.
If all three come back clean, the auction is the more likely cause, and bidding and budget are the right place to look.
ThriveX's own Pretty Little Fit engagement followed the same pattern, on an ecommerce checkout rather than a lead form. The instinct was to spend more on ads. The diagnosis found the loss sitting on the site, including a 61% drop-off at a forced account registration step. Fixing the friction points it found took conversion rate from 1.2% to 3.7% over a 90-day sprint. The full breakdown is in the Pretty Little Fit case study.
Where the ThriveX AI Audit Fits
Rising CPL is easy to misread as a market condition, and reading it that way leads to budget cuts that shrink the business instead of fixes that repair the funnel. The distinguishing evidence is in your own conversion rate, which most teams are not tracking closely enough to use.
This is where the invisible friction AI audit fits. As a CRO and AEO diagnostic consultancy, ThriveX identifies which step in the funnel is inflating your cost per lead, so the fix goes to the conversion side rather than the budget.
If your cost per lead keeps climbing and you are not sure whether it is you or the market, the audit is priced at $49 during beta, with standard pricing at $99.
FAQ
Is cost per lead going up for everyone in 2026?
No. Across all industries, cost per lead decreased overall in 2026, the first drop in five years, with an all-industry average of $66.69. Cost per click did rise, which means advertisers whose CPL fell were converting a higher share of more expensive traffic.
What is a good cost per lead?
It depends entirely on your industry, since CPL ranges from $26.84 to $131.63 across sectors. Comparing your figure to the all-industry average of $66.69 will mislead you in either direction. Find your sector's range first, then judge your number against that.
How do I tell whether rising CPL is my funnel or the market?
Compare the movement in your cost per click against the movement in your conversion rate over the same period. If CPC rose modestly and CPL rose sharply, conversion rate is the cause, and conversion rate is the input inside your control.
Should I reduce ad spend if my cost per lead is rising?
Not before diagnosing it. Cutting spend on a funnel with a conversion problem reduces lead volume without reducing cost per lead, because the underlying conversion rate has not changed. Fix the conversion step first, then decide about budget.
Further Reading
Why More Ad Spend Doesn't Mean More Conversions Without CRO First: https://www.thrivex.tech/blogs/why-more-ad-spend-doesnt-mean-more-conversions
Why Your Contact Form Is Losing You Leads: https://www.thrivex.tech/blogs/contact-form-losing-leads
Why Your Landing Page Is Not Converting: https://www.thrivex.tech/blogs/landing-page-not-converting
CRO Before Ads: Why Malaysian DTC Brands Burn Marketing Budget at the Wrong End of the Funnel: https://www.thrivex.tech/blogs/cro-before-ads
The Invisible Friction AI Audit: What Google Analytics Cannot Tell You: https://www.thrivex.tech/blogs/invisible-friction-ai-audit